← All projects · Computer Vision · AI Engineering
Recognition, Pose, Video & Anomaly
Muhammad Hammas · AI Engineer · Master's in Artificial Intelligence
Networks that find things: defects, people, actions and the unusual. Each scored on a held-out split against a bar set from published results beforehand. 7 projects.
- 0.7633frame AUC
Anomaly detection
AUC says it works, the operating points say it cannot be used
Show the resultAnomalous frames are 7.666% of the test set. At the operating point that catches 80% of them, 43.754% of all frames are flagged — so the overwhelming majority of alarms are on normal footage, and raising recall to 0.90035 pushes false positives past half of everything.
A single AUC of 0.76329 reads as a working system. It is the same model at every threshold, and there is no threshold at which it is usable. That gap is the entire reason this write-up leads with the caveat rather than the metric: AUC is a ranking summary over a pooled frame set, and pooled ranking quality is not operational performance.
features frozen ImageNet ResNet-50 (`IMAGENET1K_V2`), 2048-d, nothing fine-tuned supervision at train video-level only — "this video contains an anomaly" labels at test official per-frame temporal annotations, fetched at run time annotation coverage every official test video matched an annotation, and the folder label agreed with the annotation on every one of them (from the run log) train / test videos 1582 / 283, zero video-name overlap test frames scored 111134, of which 8520 anomalous (7.666%) frame size 64 × 64 — this dataset copy is decimated and small 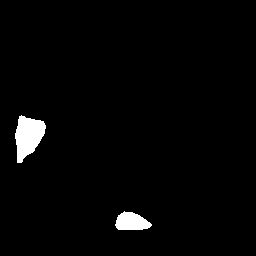
Defect localisation
Trained from scratch for 120 epochs across 12 MVTec AD object categories
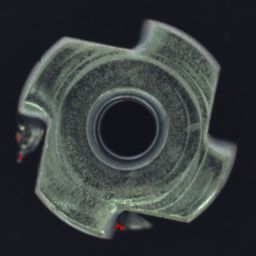
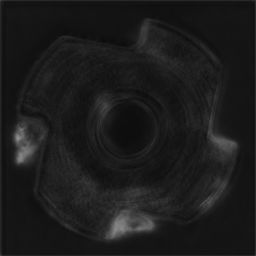
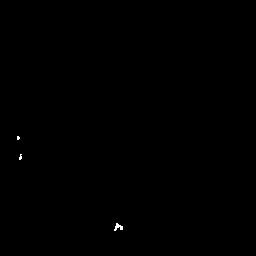
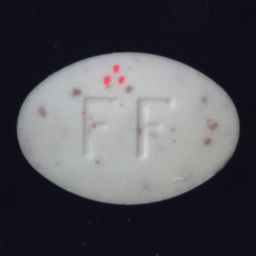
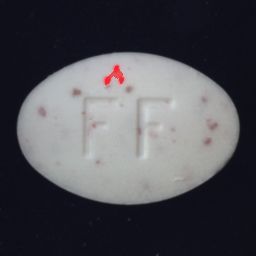
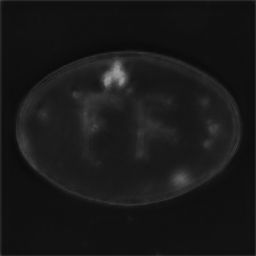
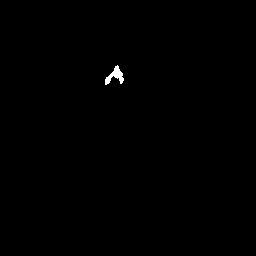
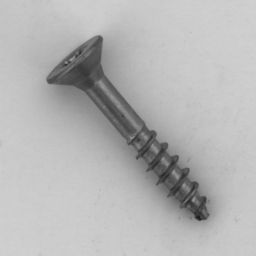
0.9583 pixel AP (test)Show the resultPixel-level localisation of manufacturing defects.
- Trained from scratch for 120 epochs across 12 MVTec AD object categories.
- Test pixel AP 0.9583, pooled IoU 0.8033, per-image IoU 0.6232. The decision threshold was tuned on the validation split.
split pixel AP train 0.9839 val 0.9565 test 0.9583 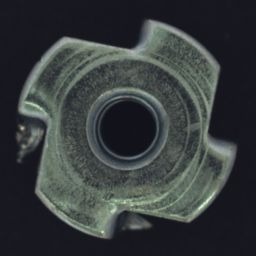


- 0.9379mean AUROC
Industrial anomaly
What the features are worth depends on what you are inspecting
Show the resultThe raw-pixel control runs the same bank, the same distance and the same scoring rule — only the representation differs. Splitting the fifteen categories into MVTec's own texture and object groups:
The representation is worth 2.3× more on objects than on textures. On a texture, a defect is a local statistical break and raw pixels already catch most of it —
leatherscores 0.9808 on pixels alone against 1.0000 with features. On an object, the defect is a part being wrong in a specific place, and raw pixels are near chance:metal_nutscores 0.4040 on pixels — below 0.5, so worse than guessing — against 0.9878 with features.Without the control, 0.9379 would have read as a fact about the method. It is mostly a fact about where the representation is doing the work.
mean image AUROC frozen ResNet-50 features 0.9379 raw 32×32 pixels, identical pipeline 0.6700 published PatchCore (trains a coreset) ~0.991 - 0.656OKS AP
Pose estimation
The per-joint ranking inverts with tolerance
Show the resultTwo different joints are "the worst" depending only on the threshold:
- At PCK@0.2 the ankles are last (0.918, 0.9192) and the hips sit comfortably mid-table (0.9418, 0.9438). - At PCK@0.05 the hips are last by a distance (0.6388, 0.6389), while the ankles (0.745, 0.7496) rank above the knees and below the wrists.
The median-error column explains why, and the two failure modes are genuinely different:
- Hips carry large typical error but a light tail. Median error 0.03637 is the worst on the body, against 0.00783 at the eyes. Yet its PCK@0.2 is 0.9418, so few hip predictions miss by more than that tolerance. A hip has no visible landmark; it is an interior anatomical guess, so almost every prediction is a little bit off and almost none is wildly off. - Ankles carry small typical error but a heavy tail. Median error 0.02244 is well under the hips', yet its PCK@0.2 of 0.918 is the lowest on the body — the heaviest tail there is. An ankle is a sharp, visible landmark that is either found precisely or lost completely to occlusion and motion blur.
So "wrists and ankles are worst" describes a tail, and the hips' problem is a bias. A single PCK number cannot distinguish those, and the one most often quoted — the loose one — reports only the tail.
### The loose threshold also hides almost all per-joint structure
At PCK@0.2 every joint scores between 0.918 and 0.9838. The table is nearly flat and reads as "this model is uniformly good". The same predictions at PCK@0.05 run from 0.6388 to 0.9607 and rank the joints in a different order. The per-joint table is only informative at a tolerance tight enough to resolve it.
Grouped at PCK@0.2, extremities (wrists + ankles, 13698 joints) score 0.92524 against 0.95931 for the core (shoulders + hips + nose, 24477 joints) — a real but modest gap that understates what is happening underneath.
images scored 2346 — every image this dataset copy ships that has an annotated person ground-truth persons 6352, of which 6237 matched a detection at box IoU ≥ 0.5 labelled joints scored 67391 of 68215 protocol official COCO OKS AP via `pycocotools`, plus PCK at three tolerances 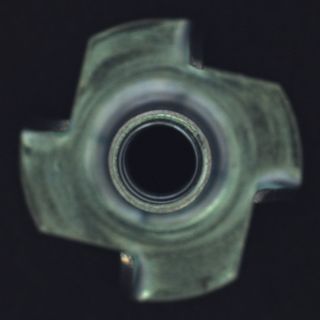
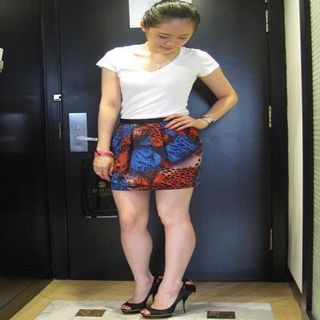
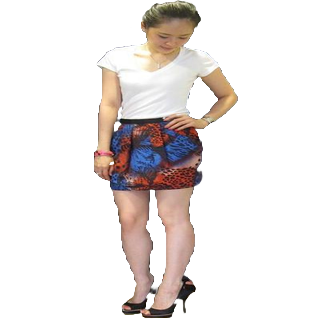
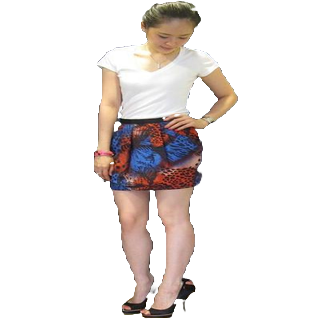
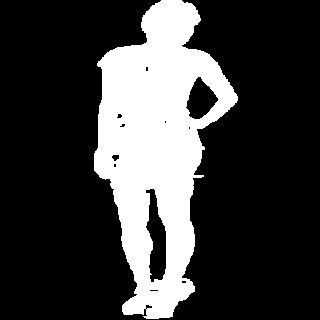
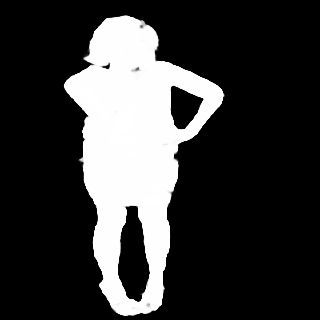
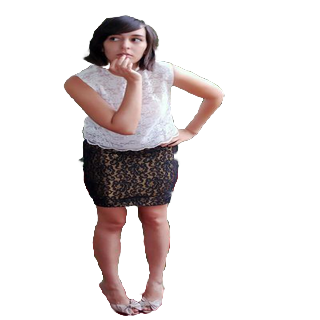
Product matting
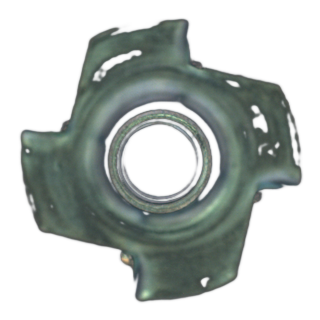
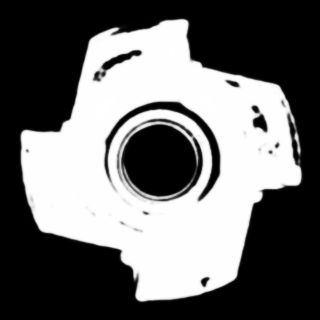
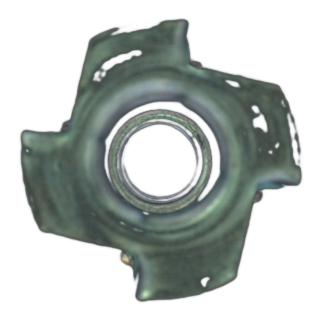
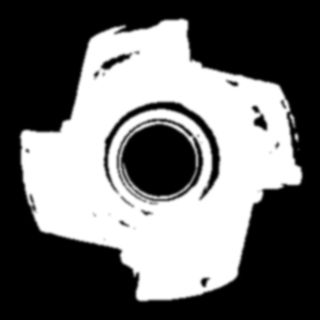
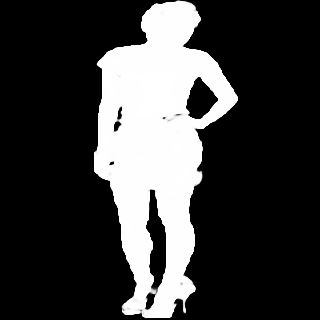
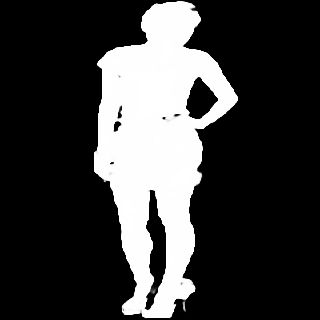
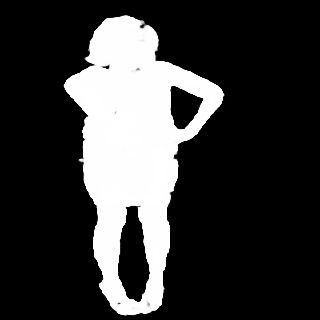
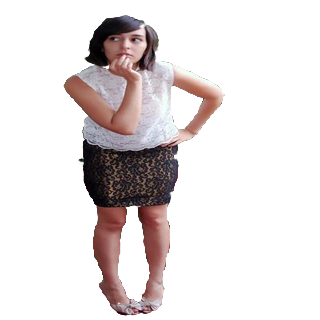
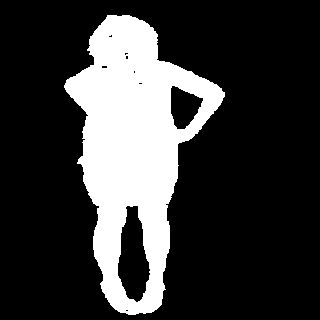
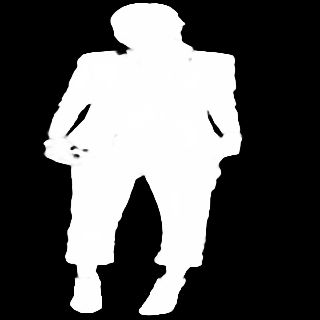
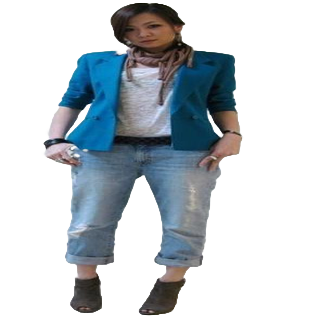
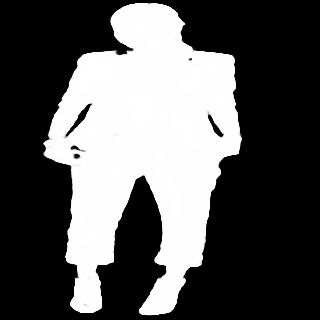
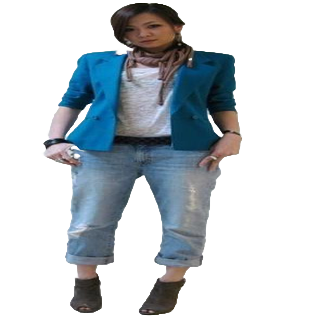
U2-Net fine-tuned for 100 epochs with BCE plus soft-dice at 320x320
0.9611 IoU (test)Show the resultAlpha matte extraction for background removal.
- U2-Net fine-tuned for 100 epochs with BCE plus soft-dice at 320x320.
- Ground-truth mattes are derived by Otsu thresholding with hole filling.
split IoU train 0.9903 val 0.9625 test 0.9611 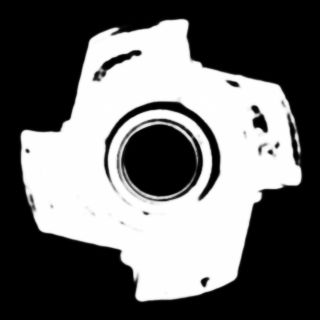

- 0.8094top-1 (held out test)
Video action recognition
The confusion pairs are all within-domain
Show the resultNot one of these is a random mistake. Read as pairs they are almost tautological:
- Same sport, different act — CricketShot/CricketBowling, BoxingPunchingBag/BoxingSpeedBag, BalanceBeam/ParallelBars, HammerThrow/ThrowDiscus. - Same medium — FrontCrawl/BreastStroke (a pool), Kayaking/Rafting (a river). - Same instrument family — PlayingDhol/PlayingTabla (drums), PlayingFlute/PlayingViolin. - Same scene and posture — BrushingTeeth confused with both ShavingBeard and ApplyLipstick: a hand raised to the face at a bathroom mirror, three times over. - Same object kinematics — YoYo/Nunchucks, two things swung on a string.
The pattern says what the representation is doing. Kinetics features encode scene, object and context strongly, and a linear read-out of them separates contexts almost perfectly — top-5 is 0.96405, so the right answer is nearly always among the handful of candidates. What a linear probe cannot do is the fine-grained temporal discrimination within a context: which swimming stroke, which cricket action, which bathroom gesture.
That is also why the worst classes are what they are:
Every one of them has a near-twin elsewhere in the label set. The gap between top-1 0.80941 and top-5 0.96405 is almost entirely this: the model is choosing wrongly among a small set of correct-context neighbours.
split official UCF101 split 1 (`trainlist01`/`testlist01`), fetched at run time and validated against the published split-1 list sizes before use classes 101 videos used 5050 train / 1082 val / 3783 test leakage checks file overlap 0 and clip-group overlap 0 on all three split pairs decode success 1.0 on all three splits device cpu — the Kaggle weekly GPU quota was exhausted - Video instance segmentation
Video instance segmentation
The model's video problem is association, not segmentation
Show the resultThe two temporal numbers disagree, and the disagreement is the result.
Frame-to-frame mask IoU for the predictions is 0.78932. For the ground-truth masks of the same objects over the same frame pairs it is 0.78441. The gap is −0.00491 — predicted masks change very slightly less between consecutive frames than the true masks do. By that measure the output is not jittery at all.
Yet on 0.10342 of consecutive frame pairs where the object is detected in both frames, the mask covering it is not linked to the mask that covered it a frame earlier. The shape is stable; the correspondence is what breaks.
This is exactly why the GT baseline has to be measured alongside. Reporting predicted frame-to-frame IoU alone (0.78932) would read as "temporally consistent". Reporting the jump rate alone would read as "jittery masks". Neither is true, and the fix each would suggest is different: what this needs is a tracking component, not a smoother mask head.
The GT number is also what makes the predicted one interpretable. Without it, 0.78932 could mean a stable model or a slow-moving dataset — DAVIS objects move enough that the true masks overlap themselves by only 0.78441 between frames.
split official `ImageSets/2017/val.txt` — 30 sequences frames scored 1999 ground-truth objects 61, across 3929 instance-frames predicted masks 17632 model COCO-pretrained, never trained on DAVIS; published COCO mask AP 34.6